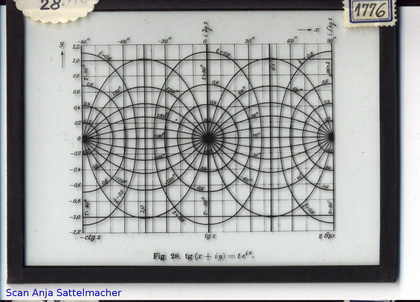
Slide: Altitude chart of the tg-relief
Model 1776
Description
Slide: tg(x+iy)=teiτ. Altitude chart of the tg-relief.
References
Jahnke, Eugen u. Emde, Fritz(1933). Tables of functions with formulae and curves. Funktionentafeln mit Formen und Kurven, 2. Auflage, Teubner Verlag, Leipzig, Fig.28.


